NATURAL GAS
March 17, 2026
Risk Disclaimer: The example below is for illustrative purposes only and is based on price movements derived from Contracts for Difference (CFDs). The calculations reflect hypothetical outcomes using historical or specified price data for the relevant instrument on the stated date and are not indicative of future performance. Any reliance placed on this material is strictly at the user’s own risk.
Natural Gas weekly special report based on 1.00 Lot Calculation:
NATURAL GAS USE AND MARKET SHARE:
- NATURAL GAS is mainly used for electricity generation and heating. In the U.S., about 45% of homes use natural gas for heating.
- MARKET SHARE - PRODUCERS: BIGGEST NATURAL GAS PRODUCERS IN THE WORLD. The U.S. is the largest producer, with ~25% of the global market share, while Russia is the second with ~15% of the market. Iran is third with ~5%.
- MARKET SHARE - LNG (LIQUEFIED NATURAL GAS) EXPORTERS: The U.S. is the major LNG exporter, holding ~21% of the global market share, while Australia is the second with ~ 20% of the market. Qatar is third with ~20% and Russia fourth with ~ 8% of the global market.
- MARKET SHARE - LNG- LIQUEFIED NATURAL GAS IMPORTERS: China is the world's largest LNG importer, with ~19-23.5% of global imports, Japan is second with ~ 16%- 18%, and the EU ~14%-15%. (Source: IEA)
GEOPOLITICS: MIDDLE EAST WAR
- MIDDLE EAST WAR ENTERS ITS THIRD WEEK. The conflict between the U.S. and Iran has intensified, with sustained airstrikes on Iranian military targets and continued missile and drone attacks by Iran on U.S. bases and allied infrastructure across the Gulf. Iran has refused ceasefire negotiations while the U.S. continues large-scale military operations. According to U.S. officials, the conflict could continue for weeks as military pressure increases.
STRAIT OF HORMUZ REMAINS CLOSED: CRITICAL LNG SUPPLY ROUTE AT RISK. The Strait of Hormuz is a critical energy chokepoint through which around 20–25% of global LNG exports pass, mainly from Qatar. It continues to remain effectively closed, with Iranian forces targeting ships attempting to transit the route. Since the conflict began, at least 16 vessels have reportedly been struck in the region.
BREAKING (MARCH 02): QATAR PAUSES LNG PRODUCTION AMID ATTACKS ON ENERGY FACILITIES. Qatar, responsible for around 20% of global LNG exports, has reportedly stopped liquefied natural gas production after its Ministry of Defense confirmed that two major energy facilities were targeted by missile and drone attacks. As Qatar exports its LNG through the Strait of Hormuz, any sustained disruption to production or shipping would significantly tighten global LNG supply, sharply increasing upside risk for natural gas prices.
EUROPE: NATURAL GAS STORAGE HAS DECLINED TO 29% OF CAPACITY
- EUROPEAN NATURAL GAS STORAGE IS 30.3% BELOW THE 5-YEAR AVERAGE. Natural gas storage levels in Europe have continued to decline, falling well below the five-year average and approaching levels last seen in April 2022. A stronger refilling season could be ahead in 2026. After cutting itself off from Russian natural gas, Europe has recently reached an agreement with the United States to increase purchases of liquefied natural gas (LNG).
EVENTS
- THURSDAY, MARCH 19 AT 15:30 GMT: U.S. WEEKLY NATURAL GAS STORAGE DATA. U.S. natural gas inventories have declined for the past 16 consecutive weeks, confirming tightening market fundamentals.
TECHNICAL ANALYSIS
- BREAKING (FEBRUARY 26): NATURAL GAS PRICE HAS HIT ITS LOWEST RATE SINCE AUGUST 2025 ($2.769).
- SUPPORT AREA: $3. Natural gas has maintained strong support near $3 since late 2024, testing the area eight times and confirming it as a solid support zone. This is the nineth time to trade near the mark of $3. However, it could also decline.
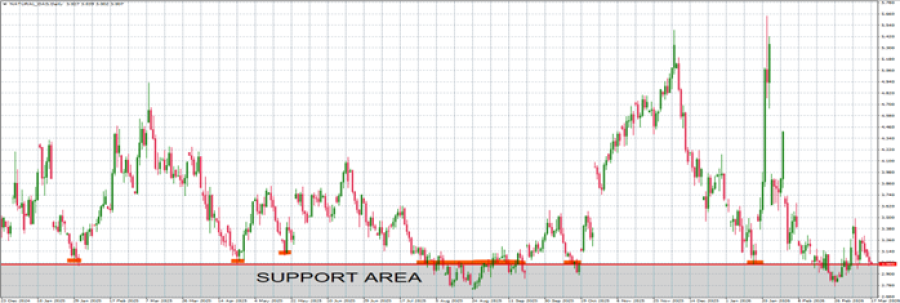
GRAPH (Daily): November 2024 – March 2026
Please note that past performance does not guarantee future results
Natural Gas, March 17, 2026
Current Price: 3.000
|
NATURAL GAS |
Weekly |
|
Trend direction |
|
|
5.000 |
|
|
4.000 |
|
|
3.500 |
|
|
2.700 |
|
|
2.650 |
|
|
2.600 |
Example of calculation based on weekly trend direction for 1.00 Lot1
|
NATURAL GAS |
||||||
|
Pivot Points |
||||||
|
Profit or loss in $ |
20,000 |
10,000 |
5,000 |
-3,000 |
-3,500 |
-4,000 |
|
Profit or loss in €² |
17,373 |
8,687 |
4,343 |
-2,606 |
-3,040 |
-3,475 |
|
Profit or loss in £² |
15,003 |
7,502 |
3,751 |
-2,250 |
-2,626 |
-3,001 |
|
Profit or loss in C$² |
27,388 |
13,694 |
6,847 |
-4,108 |
-4,793 |
-5,478 |
- 1.00 lot is equivalent of 10,000 units
- Calculations for exchange rate used as of 09:30 (GMT) 17/03/2026
There is a possibility to use Stop-Loss and Take-Profit.
- You may wish to consider closing your position in profit, even if it is lower than the suggested one.
- Trailing stop techniques could protect the profit.
Natural Gas (NG)
-100%
Trade Info
- Leverage:1 : 10
- Margin:10%
- Premium Buy:-1.5
- Premium Sell:-0.11
Open Economic calendar
2.773
Day range
2.881
12%
Sell
Market sentiment
Buy
88%