CRUDE OIL
March 9, 2026
Risk Disclaimer: The example below is for illustrative purposes only and is based on price movements derived from Contracts for Difference (CFDs). The calculations reflect hypothetical outcomes using historical or specified price data for the relevant instrument on the stated date and are not indicative of future performance. Any reliance placed on this material is strictly at the user’s own risk.
CRUDE OIL Weekly Special Report based on 1 Lot Calculation:
GEOPOLIITICS: MIDDLE EAST
- MIDDLE EAST WAR BEGAN. The war between the U.S. on one side and Iran on the other began on Saturday, February 28, with U.S. strikes on Iran that reportedly killed the Supreme Leader, Ayatollah Ali Khamenei. The war entered its ninth day on Monday (March 9), and according to U.S. officials, it could extend for another three to four weeks.
IRAN RETALIATED. Iranian forces retaliated by firing missiles and targeting U.S. bases in the region. The Iranian missiles reportedly hit several countries in the region, such as the U.A.E., Bahrain, Qatar, Kuwait, Saudi Arabia, Jordan, Oman and Iraq.
- THE STRAIT OF HORMUZ IS “CLOSED”. Iranian forces said they will not allow ships to pass through the strait. At least 200 ships, including oil tankers, LNG carriers, and cargo vessels, remain anchored in open waters off major Gulf producers such as Iraq, Saudi Arabia, and Qatar. Hundreds of additional vessels remain outside the strait, unable to reach regional ports.
OIL AND NATURAL GAS MARKET IMPACT: More than 20 million barrels of oil passes through it on a daily basis, which is more than 20% of total global demand. Qatar, which is responsible for around 20% of total Liquified Natural Gas (LNG) exports in the world, also uses the Strait of Hormuz to export its LNG.
IRAN OIL PRODUCTION (AROUND 4 MILLION BARRELS A DAY) AND OIL EXPORTS (AROUND 1.7 MILLION BARRELS A DAY) AT RISK: Iran is one of the top three oil producers within OPEC along with Saudi Arabia and Iraq.
MAJOR MIDDLE EAST PRODUCERS CUTTING OIL PRODUCTION:
- FUEL DEPOTS WERE HIT IN IRAN. U.S. forces have struck Iranian oil infrastructure for the first time, targeting four oil storage facilities and an oil transfer center in Tehran and Alborz province.
- POSSIBLE U.S. PLAN TO TARGET IRAN'S MAIN EXPORT HUB. U.S. officials have reportedly discussed the possibility of seizing Kharg Island, which is responsible for more than 90% of Iran’s oil exports.
- IRANIAN MISSILES HIT ONE OF THE LARGEST OIL STORAGE FACILITIES NEAR THE HORMUZ STRAIT IN THE U.A.E. The total tank storage capacity at JSW’s facility is approximately 2.9 million barrels.
- KUWAIT CUTS OIL PROCESSING AT ITS REFINERIES. Kuwait previously produced around 3.2 million barrels per day (bpd) and exported up to 2 million bpd.
- THE U.A.E. COULD SOON ANNOUNCE A PAUSE IN OIL PROCESSING AND PRODUCTION as storage tanks continue to fill up. The U.A.E. previously produced around 3.4 million bpd and exported up to 3 million bpd.
- IRAQ HAS STARTED CUTTING ITS OIL PRODUCTION. Iraq may be forced to reduce production by more than 3 million bpd within days if oil tankers cannot move freely and reach loading ports. Iraq has also shut down production of 460,000 bpd at the West Qurna-2 field.
- SAUDI ARABIA’S LARGEST OIL REFINERY WAS HIT BY HOUTHI FORCES. The facility is the largest refinery in the Middle East and one of the largest in the world, processing around 550,000 barrels of oil per day.
Source: Reuters, CNBC, Bloomberg
TECHNICAL ANALYSIS
- WEEKLY MOVING AVERAGES CONFIRM BULLISH MOMENTUM. Crude oil has recently surged above both 50-week and 100 -week moving averages, reflecting a sharp shift in market sentiment toward the upside.
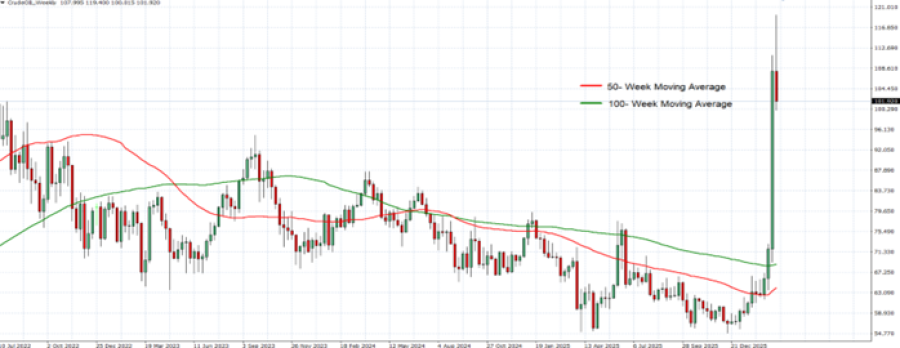
GRAPH (Weekly): November 2022 – March 2026
Please note that past performance does not guarantee future results
Crude Oil, March 9, 2026
Current Price: 100
|
Crude Oil |
Weekly |
|
Trend direction |
|
|
150 |
|
|
130 |
|
|
120 |
|
|
90 |
|
|
85 |
|
|
80 |
Example of calculation based on weekly trend direction for 1.00 Lot1
|
Crude Oil |
||||||
|
Pivot Points |
||||||
|
Profit or loss in $ |
50,000 |
30,000 |
20,000 |
-10,000 |
-15,000 |
-20,000 |
|
Profit or loss in €² |
43,235 |
25,941 |
17,294 |
-8,647 |
-12,971 |
-17,294 |
|
Profit or loss in £² |
37,453 |
22,472 |
14,981 |
-7,491 |
-11,236 |
-14,981 |
|
Profit or loss in C$² |
67,680 |
40,608 |
27,072 |
-13,536 |
-20,304 |
-27,072 |
1. 1.00 lot is equivalent of 1000 units
2. Calculations for exchange rate used a 11:15 (GMT) 9/3/2026
There is a possibility to use Stop-Loss and Take-Profit.
- You may wish to consider closing your position in profit, even if it is lower than the suggested one.
- Trailing stop techniques could protect the profit.
Crude Oil (CL)
-100%
Trade Info
- Leverage:1 : 10
- Margin:10%
- Premium Buy:-36.9
- Premium Sell:-2.13
Open Economic calendar
97.49
Day range
113.905
64%
Sell
Market sentiment
Buy
36%