USD/JPY
March 17, 2026
Risk Disclaimer: The example below is for illustrative purposes only and is based on price movements derived from Contracts for Difference (CFDs). The calculations reflect hypothetical outcomes using historical or specified price data for the relevant instrument on the stated date and are not indicative of future performance. Any reliance placed on this material is strictly at the user’s own risk.
USD/JPY Weekly Special Report based on 1.00 Lot Calculation:
EVENTS:
- WEDNESDAY, MARCH 18 AT 18:00 GMT: US FEDERAL RESERVE (FED) INTEREST RATE DECISION. PRESS CONFERENCE AT 18:30 GMT. The Federal Reserve is expected to keep interest rates unchanged at 3.75%. The bank is also expected to address the U.S.–Iran war’s impact on its monetary policy going forward. The Fed is expected to release updated economic forecasts for GDP growth, inflation, unemployment, and the interest rate path for 2026, 2027, and 2028. Any signals pointing toward future rate cuts could weigh on the U.S. dollar and support further downside in USD/JPY.
- THURSDAY, MARCH 19 AT 03:00 GMT: BANK OF JAPAN (BOJ) INTEREST RATE DECISION. The Bank of Japan is expected to keep rates unchanged at 0.75%, but markets will focus on any signals from Governor Kazuo Ueda regarding the timing of future rate hikes. According to Reuters, rising oil prices driven by the Middle East conflict and a weaker yen are increasing inflationary pressures in Japan. Any indication that the BOJ remains open to further tightening could support the yen and reinforce downside pressure on USD/JPY.
TECHNICAL ANALYSIS:
- STRONG RESISTANCE: 155 – 160. This area has acted as a major resistance since April 2024, with USD/JPY testing it multiple times over the past two years. The pair has recently surged back into this zone, reaching its highest levels since July 2024, and is now trading in the upper range of the resistance area. This reinforces it as a strong ceiling, which may limit further upward movement. Failure to break firmly above 160 could trigger a rejection and a move lower. However, it could also increase.
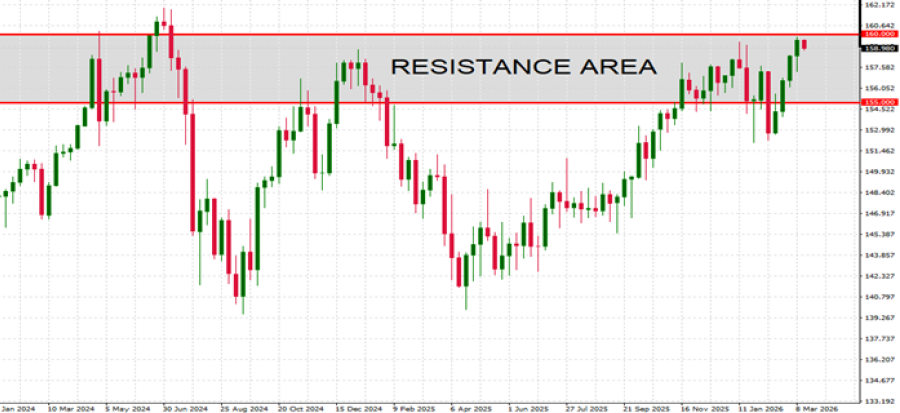
GRAPH (Weekly): January 2024 – March 2026
Please note that past performance does not guarantee future results
USD/JPY, March 17, 2026
Current Price: 159.00
|
USD/JPY |
Weekly |
|
Trend direction |
|
|
163.00 |
|
|
162.50 |
|
|
162.00 |
|
|
155.00 |
|
|
152.00 |
|
|
150.00 |
Example of calculation base on weekly trend direction for 1.00 Lot1
|
USD/JPY |
||||||
|
Pivot Points |
||||||
|
Profit or loss in $ |
-2,516 |
-2,201 |
-1,887 |
2,516 |
4,403 |
5,661 |
|
Profit or loss in €2 |
-2,185 |
-1,912 |
-1,639 |
2,185 |
3,824 |
4,916 |
|
Profit or loss in £2 |
-1,887 |
-1,651 |
-1,415 |
1,887 |
3,302 |
4,246 |
|
Profit or loss in C$2 |
-3,447 |
-3,016 |
-2,585 |
3,447 |
6,033 |
7,756 |
- 1.00 lot is equivalent of 100,000 units
- Calculations for exchange rate used as of 11:50 (GMT) 17/03/2026
There is a possibility to use Stop-Loss and Take-Profit.
- You may wish to consider closing your position in profit, even if it is lower than suggested one.
- Trailing stop technique could protect the profit
USD/JPY
-100%
Trade Info
- Leverage:1 : 200
- Margin:1%
- Premium Buy:0
- Premium Sell:-24.79
Open Economic calendar
159.417
Day range
159.875
78%
Sell
Market sentiment
Buy
22%